This Is Why British Politics Feels Broken
Up to 28% of respondents are excluded from headline poll figures. Millions more cast votes that barely translate into representation. | Reading time: 12 mins
"Reform UK Limited 24%. Labour 19%. Conservative 18%. Green 17%..."
If you follow the news, you'll have seen numbers like these. They're the "voting intention" polls (the ones that predict who'd win if there was an election tomorrow). They're on most news bulletins, many front pages, and litter tweets by pundits. These numbers also become the basis for why certain parties get more airtime, which becomes a bit of a self-fulfilling prophecy.
Did you know that these polls are often missing about a third of the people who were actually asked?
The media talks about poll fluctuations as if people swing from one party to another. They don't. They tune in or out, or finally see something, or someone, worth showing up for. That's a completely different story, and it's the one that never gets told.
For instance, YouGov surveyed 2,384 adults on 15-16th February 2026. Here's what they found: Reform 19%. Labour 13%. Green 13%. Conservative 13%. Lib Dem 9%. Would not vote 12%. Don't know 13%. Refused to take part in the survey 3%.
And yet, if you read the media coverage, 28% of respondents - more than any single party - are stripped out before the press released and infographicked numbers that get published.
Yes, these would not vote, don't know and refused categories are removed before the headline-grabbing percentages are calculated. Surely such a huge amount of people being disengaged is noteworthy too?! Oddly, this is standard practice under British Polling Council reporting rules.
■ Don't know 13%
■ Refused 3%
Every major UK pollster partakes in this erasure: YouGov, Survation, Ipsos, More in Common, Opinium, Techne, Find Out Now, etc. They ask people how they'd vote. Then they remove everyone who responds "don't know", "would not vote", or "refused" and recalculate the percentages as if those people don't exist.
The British Polling Council requires them to publish the full data, so the real numbers are there if you go looking. But the media only reports the stripped-down version. A quarter to a third of the country disappears.
I get why they do it. These are rational methods for predicting election results. But they're a terrible way of representing the national mood. And when the media reports them without context, it makes a lot of people feel like they don't exist.
Who benefits from this framing?
When every bulletin leads with "Reform leads on 24%", it creates a sense of inevitability. It makes a party with 5 seats (plus however many Tory defections) look like the country's dominant political force. It often demoralises progressives and energises the right. And it happens in a media landscape where the ownership question is almost never asked.
The UK's major newspapers reflecting and sometimes co-commissioning these polls are owned by a handful of billionaires, several of whom are non-doms who don't pay full UK taxes.
GB News, which amplifies Reform-friendly narratives daily, was co-founded by Paul Marshall - who poured over £200 million into the project despite substantial losses. Think tanks like Legatum and Policy Exchange fund seemingly independent analysis that feeds directly into broadcast media. Former ministers become broadcasters. The revolving door between politics, media, and lobbying has created a class of algorithm-savvy political influencers whose business model depends on outrage, not accuracy.
The media becomes part of the infrastructure of the right. Stripped-back polls are part of it - not because pollsters are biased, but because "Reform surges" is a better headline than "a third of the country has given up on all of you." The first story serves the attention economy. The second one challenges it.
Then there's the sense that people are moving from one party to another, due to percentage shifts, when sometimes it's undecided people making their mind up or a chunk of people becoming disillusioned by a party or politics in general.
This article continues below this invitation to sign up...
Who are the missing 28%?
They're not random. And they're not evenly spread.
YouGov's demographic breakdown suggests...
The working class. Young people. The North. The nations. The people most let down by politics are the first ones removed from the conversation about it.
This disengaged bloc is bigger than any single party. And yet due to the way the BBC represents the election results, nobody on Question Time or in the audience, speaks for them.
Notably, women overall show higher disengagement than men (32% vs 22%).
Age is even more stark: 36% of 25–49-year-olds are disengaged, compared to just 17% of over-65s.
This kinda makes sense because trust in government dropped to 12% in 2024, down from 40% in 1986 (NatCen British Social Attitudes).
One take away from all of this is that there needs to be a lot more studies into why people don't vote or won't vote, but these aren't people who don't care. They're people the system has trained to believe their voice doesn't count and politics doesn't represent them and they have no power...
They're wrong about that. These are the people who could change everything at a by-election or local election and definitely at a general election.
Meanwhile, around 45% of the UK public supports upgrading our voting system and switching from first past the post to proportional representation, though support varies by party and 25-30% remain undecided.
It's worth noting that one in five Green voters said they would vote tactically at the general election (YouGov: 2024 & 2026), and many people lent their votes to get the Tories out. And yet, support for proportional representation has fallen among Reform UK voters (YouGov: 2026).
Beyond the 28%: the people who can't vote at all
The 28% are at least being asked. Millions more aren't even in the room.
In YouGov surveys of "GB Adults" i.e. all adults, regardless of whether they're eligible to vote. The 28% who say they won't vote, don't know, or refuse to answer are stripped out before the headline numbers are calculated. But there's no distinction made between someone who's disengaged by choice and someone who's disenfranchised by law.
Around 6.8 million non-citizen residents live in the UK. Of those, JCWI estimates around 5 million are barred from voting in general elections - people who work here, pay taxes here, and have done for decades. Then there are the eligible citizens who aren't on the register. The Electoral Commission found that the register is only 86% complete. A cross-party parliamentary committee estimated that up to 8 million people could be incorrectly or un-registered - and warned they face effective disenfranchisement at the next election. Registration is lowest among young people (just 60% of 18–19-year-olds), ethnic minority communities, private renters, and lower socioeconomic groups. The same communities that disappear from the headline polls.
And since 2022, you need photo ID to vote. At the 2024 election, an estimated 400,000 people were turned away at polling stations because they didn't have the right identification. Research shows that the groups least likely to hold accepted ID are poorer, less educated, and older voters.
Add it up and the scale is staggering. The chart below traces what happens between 67.6 million people living in the UK and the 9.7 million who voted for the government - in five steps.
The 28% in the polls is the visible tip of a much larger democratic deficit.
And it's getting worse
In a recent YouGov tracker, the number of people saying they "would not vote" jumped from 9% to 12% between early and mid-February 2026. The combined disengagement rate (everyone who said don't know, would not vote, or refused) has climbed from around 19% before the 2024 election to 28% now.
Not voting isn't the absence of a political act. It is one, however, with unpredictable consequences for everyone. When a third of the population drops out (whether in elections or in polls), it inflates the apparent power of whoever remains, and right now that may benefit Reform more than anyone.
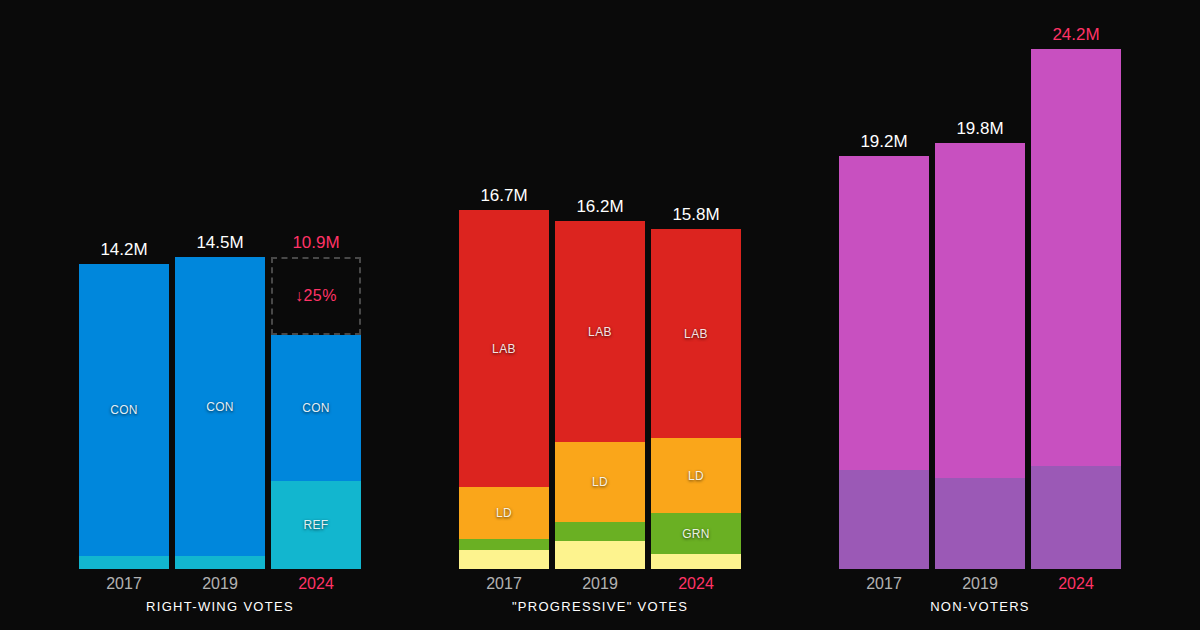
The right is shrinking
The combined right-wing vote dropped from 14.5 million in 2019 (for Tories and Brexit Party) to 10.9 million in 2024 (for Tories and Reform).
It's fair to suggest that despite how much airtime they get and how Labour repeatedly implements policies that appeal to Farage's flock, Reform largely cannibalised Conservative support within a shrinking right-wing turnout.
For context, here's the detail from the last three elections.
To be fair, this is nothing new: Britain has never been a big-C Conservative country. It's just had a conservative-friendly first past the post electoral system.
In 9 of those, the Conservatives formed government anyway.
The only exception: 2015, when UKIP's 12.6% tipped the right-wing total past 50%.
Source: Electoral Calculus / House of Commons Library
A system that doesn't count
To be clear, under first-past-the-post (our current electoral system), seats don’t reflect total vote share proportionally.
In 2024, if you take the total votes for party and divide it by number of seats won, it took 24,000 votes to elect a Labour MP, but 820,000 to elect a Reform MP. A Labour vote was worth 34 times more than a Reform vote.
In 2024, 58% of ballots were cast for candidates who did not win their constituency. Some analysts argue the effective figure is higher - around 70% - when including surplus votes for winning candidates.
Yes, more than half the country voted and it made no difference and they are not represented in parliament.
Then there's the "loveless landslide": Keir Starmer won 411 seats with 9.7 million votes. In 2017, Jeremy Corbyn got 12.9 million votes and won 262 seats.
Fewer votes, more power? That's not democracy. That's an electoral system that rewards geographic efficiency over democratic legitimacy. It also means that a government with a massive majority has almost no mandate, which partly explains why trust in government hit 12% last year.
The current system manufactures outcomes, and voters can feel it, even if they can't always name it.
This is why people stop voting. It's not because they don't care. It's because the system is ill-designed and power is oddly distributed. And not only do the halls of power leave them out, the polls erase them too.
Who's actually reaching these people?
Here's what I keep coming back to. There's a political class and a posh media class who make politics seem deliberately complicated, deliberately removed from everyday life. Westminster-speak. Insider jargon. A world of think tanks and special advisers and people who went to the same six schools.
But something is shifting. The politicians cutting through right now are the ones who don't sound like politicians. Zack Polanski, the Green Party's co-leader since September 2025, has tripled party membership to 195,000, making the Greens larger than the Lib Dems or the Conservatives. 38% of 18-24 year olds say they'd vote Green (YouGov, Feb 2026).
Part of the reason for this is that when Polanski talks about wealth redistribution and public services and the genocide in Gaza, he talks about it like a normal person, not a policy document.
In New York, Zohran Mamdani is doing something similar, building a multiracial working-class coalition that puts economic justice and community at its centre.
And in Gorton and Denton, where all of this theory meets reality on 26 February, Hannah Spencer is showing what happens when you run a values-first campaign in a constituency where 40% of voters are undecided or disengaged.
Gorton and Denton: where theory meets the ballot box
Every argument in this article from the erasure, the progressive majority to the power of the disengaged gets tested on 26th February in a single constituency in Manchester.
Omnisis polled 452 voters in the constituency between 13-19 February. Here's what they found.
57-58% of Green and Lib Dem voters would switch to Labour to stop Reform.
In a straight Lab vs Reform national contest: Labour 35%, Reform 31%.
Source: YouGov tactical voting study, Feb 2026
Labour has questioned the Omnisis poll's sample size of 452. For context, this is standard for constituency-level polling - comparable to the samples used by Lord Ashcroft's widely-cited constituency polls. We hear that a second poll - that will be live soon - points in the same direction...
For context, this is a constituency where 45% of children live below the breadline, according to constituency profile data. In Longsight East, the poorest neighbourhood in the area, average household disposable income is just £23,000 a year - less than half that of Manchester's highest-income neighbourhood.
The previous Labour MP, Afzal Khan, was suspended from the party over comments made in a WhatsApp group. Labour's 13,000 majority from 2024 means nothing here because the people who created it have already moved on.
The question is where they move to. And the data says: if they show up, Reform loses.
What you can do about it
The evidence points to two structural failures. The first is a voting system that wastes most ballots. The second is a media ecosystem that makes the undecided and disengaged voters invisible by reporting a version of reality with a third of the population removed.
Both can be fixed. Both are already being worked on.
If you're in the 28%, or if you know people who are: the combined non-voter and undecided bloc is larger than any single party.
In Gorton and Denton, 40% of the constituency is in play. These aren't apathetic people. Polling consistently shows they care about the same things - housing, the NHS, economic fairness - they just don't believe the system will deliver. The data says they're right about the system. But it also says they have more power than they think.
Two things need to happen, and they need to happen at the same time.
First: vote tactically. Under the current system, if three progressive parties each get 20% and Reform gets 25%, Reform wins, even though 60% of voters wanted someone else. That's why tactical voting matters. StopReformUK.vote uses proper constituency polling from BPC-registered pollsters to work out which candidate can actually beat Reform in your seat. Not vibes. Not MRP projections. Not bookies' odds. Actual local data.
Carol Vorderman - who, together with the Stop The Tories campaign, helped 1.75 million people look up tactical voting guidance in 2024 - wrote about the movement's potential in her fantastic book Now What?.
Second: fight for proportional representation. 60% of the public already support it. Under PR, every vote counts equally. A Labour vote and a Green vote and a Reform vote all carry the same weight. No more 58% of ballots going in the bin. No more 820,000 votes to elect one Reform MP while Labour needs 24,000. The Electoral Reform Society and Make Votes Matter are leading that fight.
And if you care about what's driving all of this, about the billionaire class and the fossil fuel lobbyists and data-guzzling surveillance companies like Palantir shaping policy while a third of the country checks out of democracy, look at what Tax Justice UK and Patriotic Millionaires UK are doing. Economic justice isn't separate from democratic reform. It's the reason democratic reform matters.
The data is clear. Britain has voted progressive at 16 of the last 17 elections. The right is shrinking but can still win power. The progressive majority already exists. The 28% aren't missing. They're waiting for a system that counts their voice, and media that doesn't pretend they don't exist.
To put it another way, the question isn’t whether our politics is broken beyond repair. It’s whether we - collectively - choose to fix it.
Sources
National polling: YouGov voting intention tracker (15–16 February 2026, 2,384 GB adults). Full data tables including "would not vote", "don't know" and "refused" responses.
Gorton & Denton: Omnisis constituency poll (13–19 February 2026, 452 voters). Commissioned by Opal. Published via Green Party and StopReformUK.vote.
Tactical voting: YouGov tactical voting landscape (February 2026). StopReformUK.vote methodology.
Election data: BBC Election Results (2017, 2019, 2024). House of Commons Library briefing papers CBP-7979, CBP-8749, CBP-10009. Electoral Commission.
Historical vote share (1959–2024): Electoral Calculus. House of Commons Library. Wikipedia election result pages cross-referenced.
Trust & attitudes: NatCen British Social Attitudes Survey 41 (trust in government: 12% in 2024). Electoral Reform Society (60% support for PR).
Support for PR: Support for proportional representation has fallen among Reform UK voters, YouGov. See also: YouGov polling for Electoral Reform Society, 2024.
Polling methodology: British Polling Council Rules of Disclosure. Focaldata 2024 Post-Election Methodology Review.
Democratic deficit data: JCWI: Migrants' rights and the General Election 2024. TBIJ: 'It's a basic civil right': millions in UK unable to vote due to immigration status. Levelling Up Committee: Millions of voters face being disenfranchised at next General Election. Economics Observatory: What do we know about voter turnout?
Charts: "Progressive" = Labour + Liberal Democrat + Green + SNP + Plaid Cymru. "Right-wing" = Conservative + UKIP/Brexit Party/Reform UK.
Methodology notes
"Progressive" grouping: Labour + Lib Dem + Green + SNP + Plaid Cymru is editorial shorthand. These parties do not form a formal bloc and have significant policy disagreements. The scare quotes throughout the article are intentional. The remaining "Others" (~6.9% in 2024) break down as follows. On the left/centre-left: Plaid Cymru (0.7%), Sinn Féin (0.7%, abstentionist), SDLP (0.3%), Alliance NI (0.3%), Workers Party (0.1%), and most 2024 independents - including several who won seats on pro-Gaza, anti-Starmer platforms. On the right: DUP (0.6%), TUV (0.1%), UUP (0.3%). Northern Ireland has a distinct political landscape that doesn't map neatly onto GB left/right categories. This is a simplification and should be treated with sensitivity.
"58% of votes went to losing candidates": House of Commons Library. Some analysts calculate a higher figure (~70%) by including "surplus" votes for winning candidates above the margin needed to win. The Electoral Reform Society's methodology for "wasted votes" combines both categories. We use the more conservative 58% in our charts and the higher estimate in text where noted.
Turnout figures: The BBC reported 2024 turnout as 59.8%; the Electoral Commission and House of Commons Library report 59.7%. We use 59.7% as the authoritative figure. The −7.5pp change from 2019 is based on the BBC's rounding.
"Register only 86% complete": The Electoral Commission's 2024 register accuracy report puts completeness at "between 82–86%". We use the upper estimate. The ~4.8M unregistered figure is derived from the gap between ONS eligible adult population estimates and the registered electorate (48.2M).
Under-18s and non-citizens: Under-18s from ONS mid-year population estimates (~22% of UK population). Non-citizen residents estimated from Census 2021 + ONS international migration data (~10% of population). These groups overlap slightly with other categories but are presented as distinct segments for clarity in the Democratic Deficit chart.
Starmer vs Corbyn vote totals: Starmer 2024: 9,708,716 votes (411 seats). Corbyn 2019: 10,269,051 votes (202 seats). Corbyn 2017: 12,878,460 votes (262 seats). All figures from BBC / House of Commons Library verified results.
Votes per seat (2024): Calculated as total party votes ÷ seats won. Labour: ~24k. Lib Dem: ~47k. Conservative: ~56k. SNP: ~83k. Green: ~485k. Reform: ~820k. Source: House of Commons Library CBP-10009.
Omnisis sample size: 452 respondents is standard for constituency-level polling - comparable to the samples used by Lord Ashcroft's widely-cited constituency polls and within BPC guidelines for sub-national polling.
YouGov "GB Adults" sample: YouGov's panel samples all GB adults aged 18+, not filtered for voting eligibility. The 28% disengaged figure is therefore drawn from everyone surveyed, including people who may not be eligible to vote. Headline voting intention figures also exclude these respondents without distinguishing between "won't vote by choice" and "can't vote by law."